Bar charts sort the given hierarchies and measures into bars. The hierarchy added to the Categories zone will be represented on the y-axis, and the measure in the Values zone will be on the x-axis. Like column charts, bar charts must contain at least one member hierarchy and one measure. Member hierarchies can be added to the Categories or Color drop zones, and measures to the values zone.
- On the ribbon, click the Components tab to see Chart Design
Building a Bar Chart
Before you begin
Create a new discovery from the User Hub, App Tabs, or on the right-click in the Content Explorer. As part of this process, you will need to open the appropriate Data Model for your analysis. For more information, see Access Discover Pro.
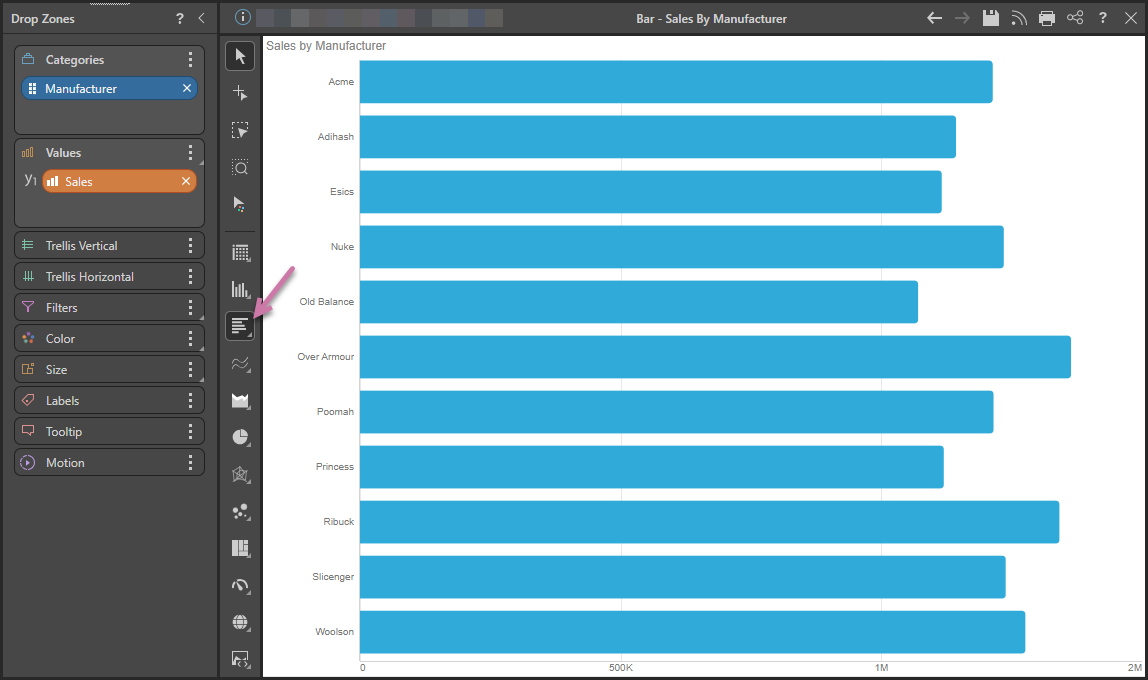
Step 1: Create your Basic Visual
To set up the basic visual:
- Add the hierarchy to the Categories zone.
- Select Bar Chart from the Toolbox (purple arrow below).
- Add the measure to the Values zone.
Double-click the dimension in the Dimensions panel.
Tip: You can right-click this option to open the submenu options and select Bar Chart, Stacked Bar Chart, Stacked 100% Bar Chart, and Tornado Chart.
Double-click or select the measure that you want to add in the Measures panel.
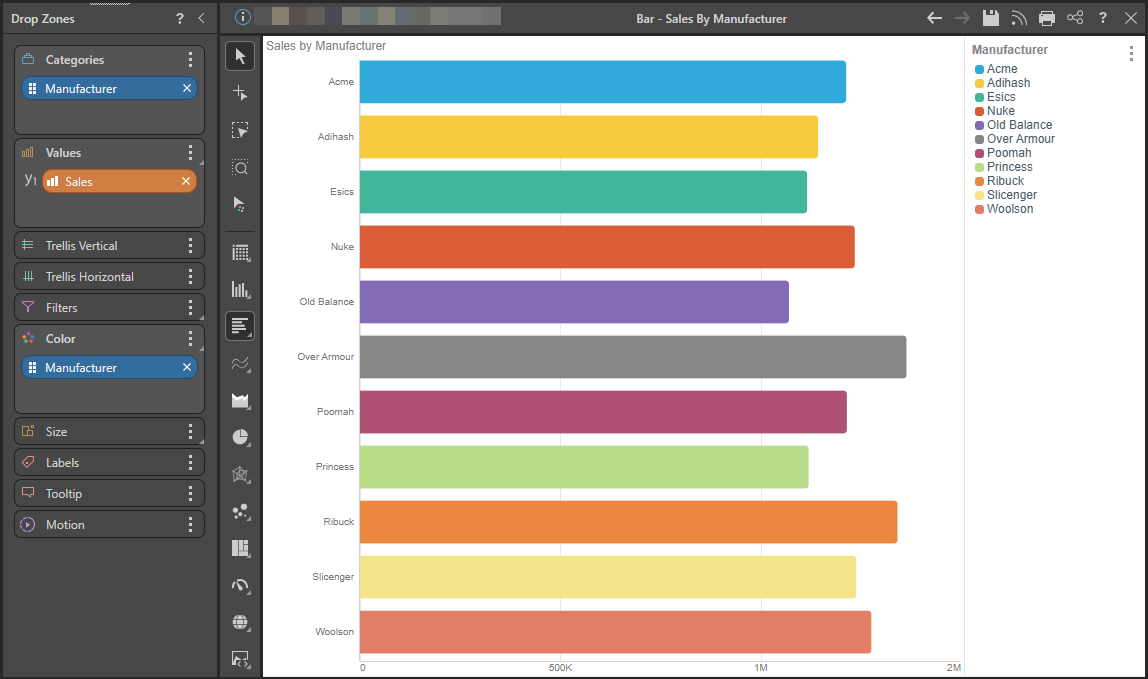
Step 2: Add More Hierarchies
Use the Color drop zone to add different measures and hierarchies to the query:
Color per Country
To add a color dimension to the query, you can move or copy the hierarchy from Categories to Color:
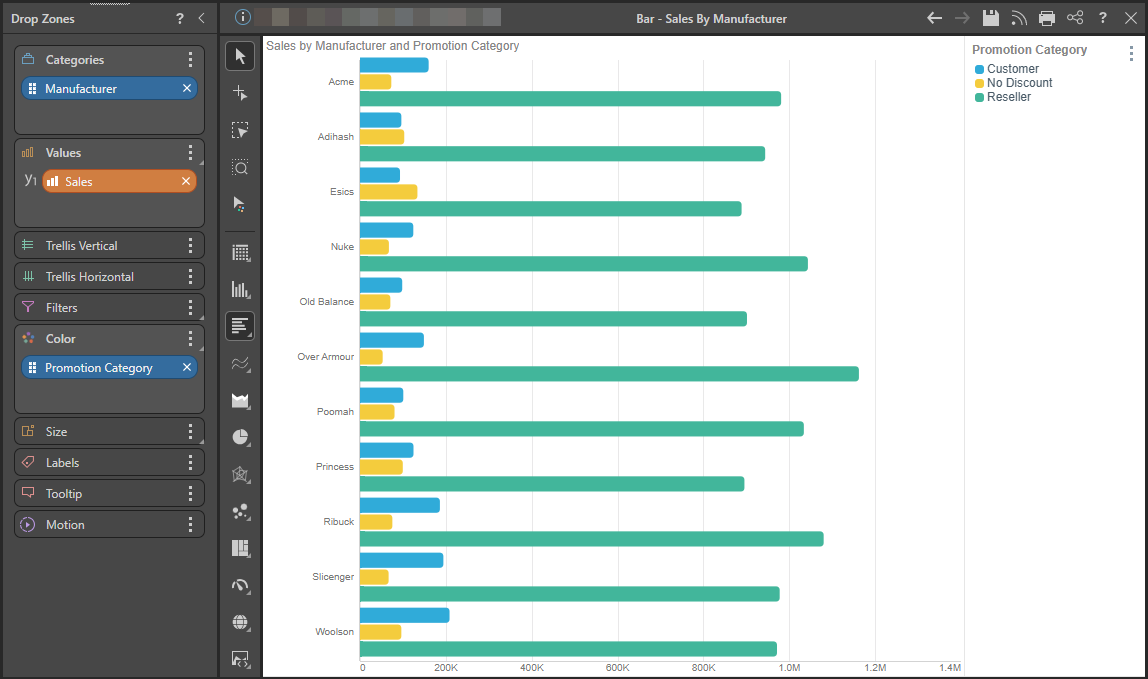
Multiple Hierarchies
You could, alternatively, also add a different hierarchies to the Categories and Color drop zones:
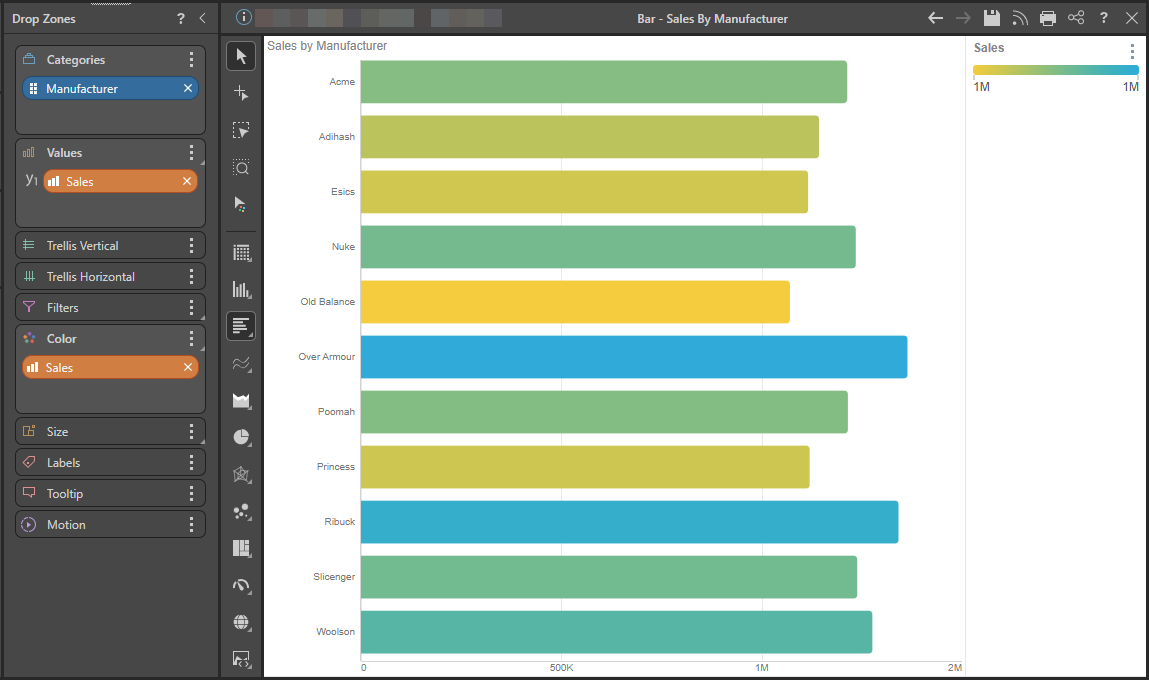
Measure Colors
Lastly, you can add a different measures to the Values and Color drop zones: